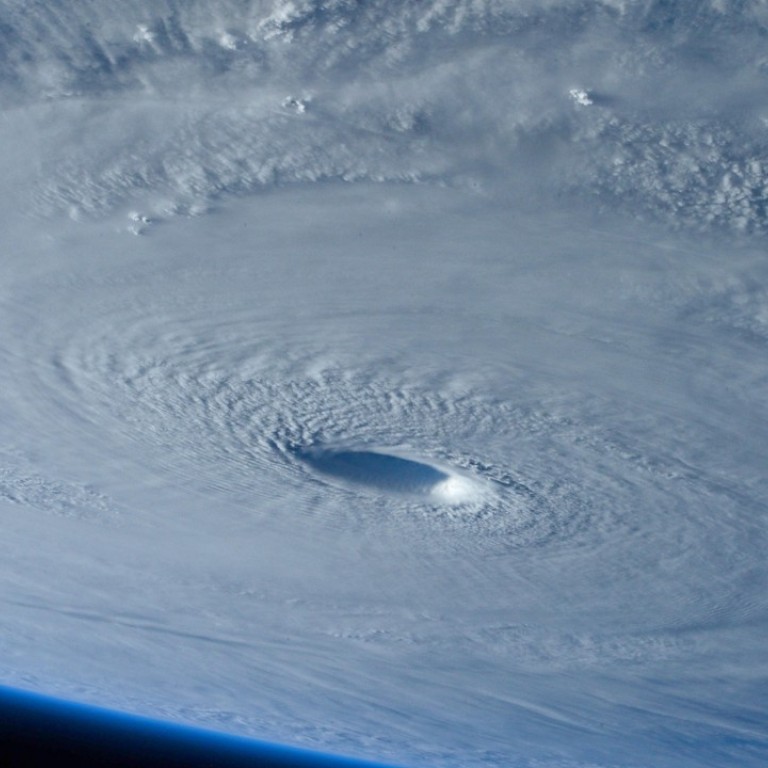
Extreme Hong Kong weather and how it compares to the rest of the world
With memories still fresh of May’s record heatwave in the city, we look back at some of the hottest, coldest, wettest and windiest moments in Hong Kong’s history and contrast them with global extremes
Last year was one of the hottest years on record, with eight temperature records broken, including the highest temperature (36.6 degrees Celsius) ever recorded at the Hong Kong Observatory. Five typhoon 8 warnings were issued as nine tropical cyclones came within 500km of the city.
This May also saw a record heatwave for the month. Is Hong Kong’s weather getting more extreme? We look back at some of the hottest, coldest, wettest and windiest moments in the city’s history and compare them to global extremes.
Hong Kong is classified as having a humid subtropical climate. Its meteorological records date back to 1884, with a break from 1939 to 1947 for the second world war.
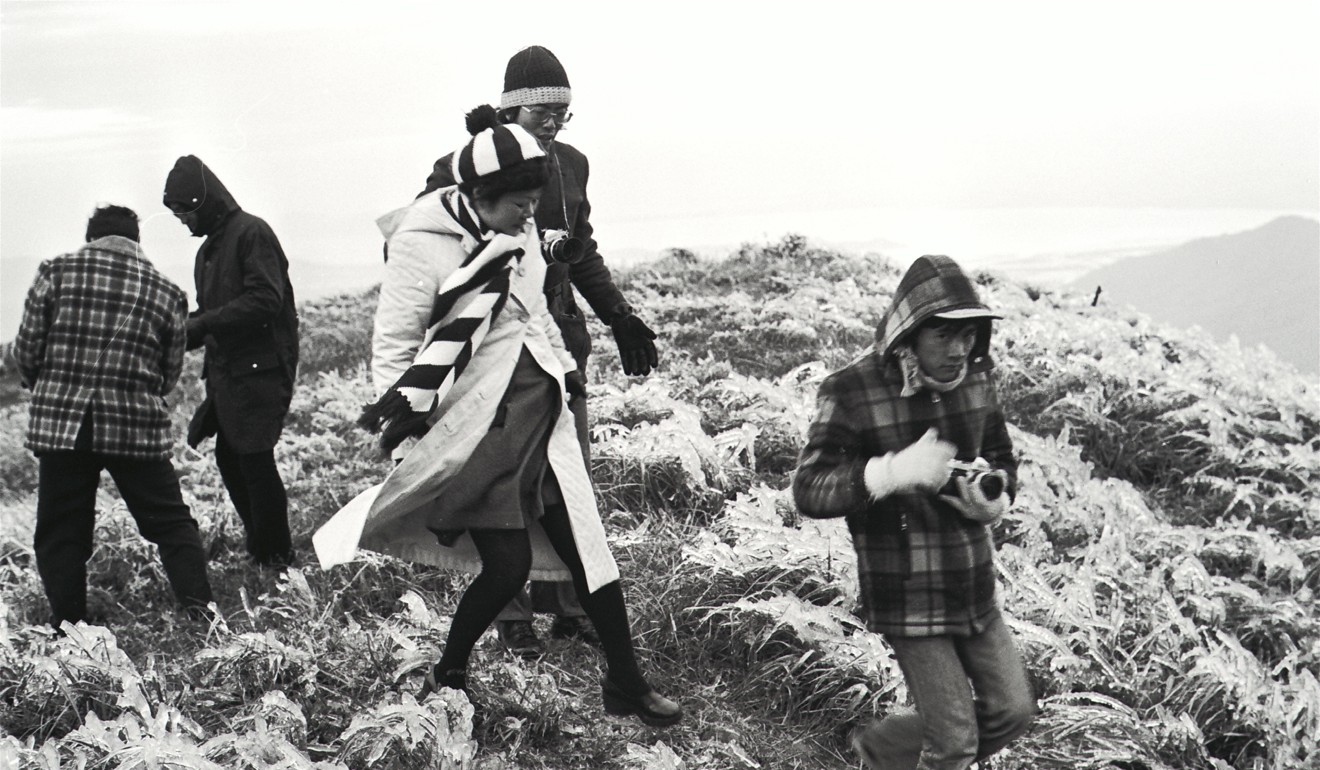
Winters are mild and lower in humidity. Early winter is usually sunny, becoming more cloudy in February. Cold fronts from the north and northeast bring strong winds. Snow is extremely rare and has only been seen at the highest elevations. Snow was recorded on four days: twice in February and December 1967, in January 1971 and December 1975. On the coldest days frost can be seen at high elevations.
Spring can be changeable in Hong Kong, with dry sunny days and humid cloudy days.
Summers are hot and humid with sometimes heavy rain and thunderstorms coming mostly from the southwest.
Typhoon season is roughly from May to October with the majority happening in July and August. Autumn brings sunnier, drier and cooler weather though, with Hong Kong getting an average of 1,709 hours of sunshine per year.

Temperature
The highest official recorded temperature was 36.6 degrees Celsius at The Hong Kong Observatory on August 22, 2017, the day before Hong Kong was hit by Typhoon Hato.
A temperature of 39 degrees was recorded in Tin Shui Wai at the Wetland Park on the same day.
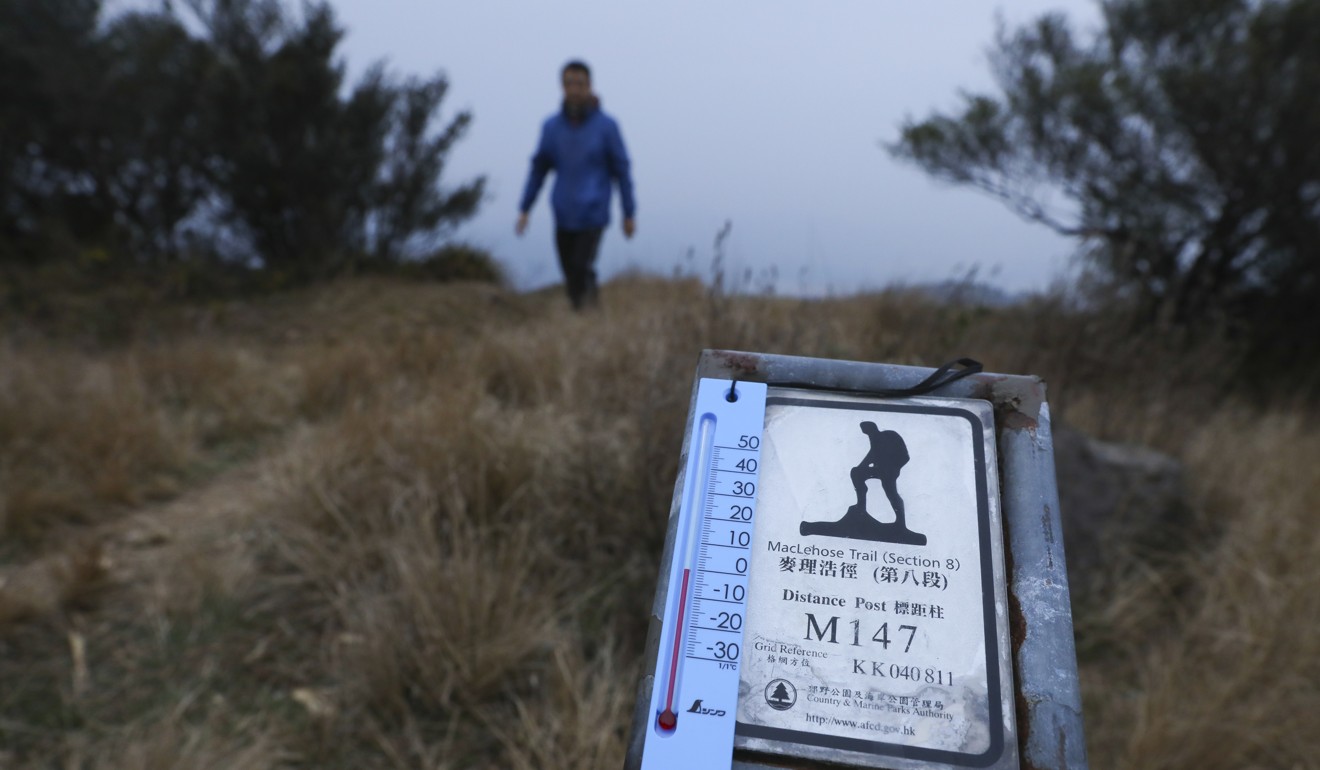
The lowest recorded temperature was minus six degrees Celsius at Tai Mo Shan (Hong Kong’s highest point) in January 2016.
Rainfall
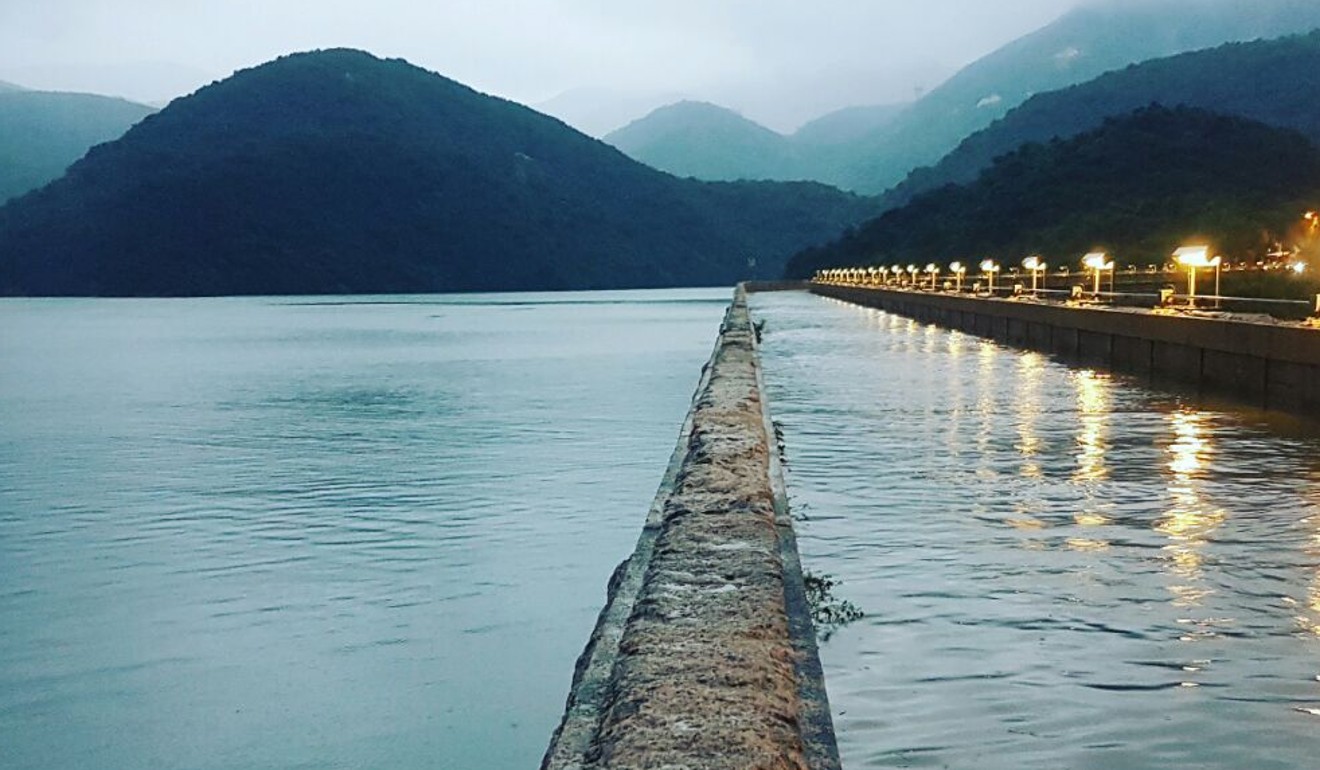
When it rains in Hong Kong, it pours. The city even has its own heavy rain warning and classification system. The amber warning is issued for rain that exceeds 30mm per hour, red tops 50mm and black is for anything over 70mm.
In 1997 Hong Kong soaked in 3.34 metres of rain. May (1.24 metres in 1889), June (1.35m in 2008), July (1.15m in 1994) and August (1.09m in 1995) have all seen more than a metre fall in one calendar month.
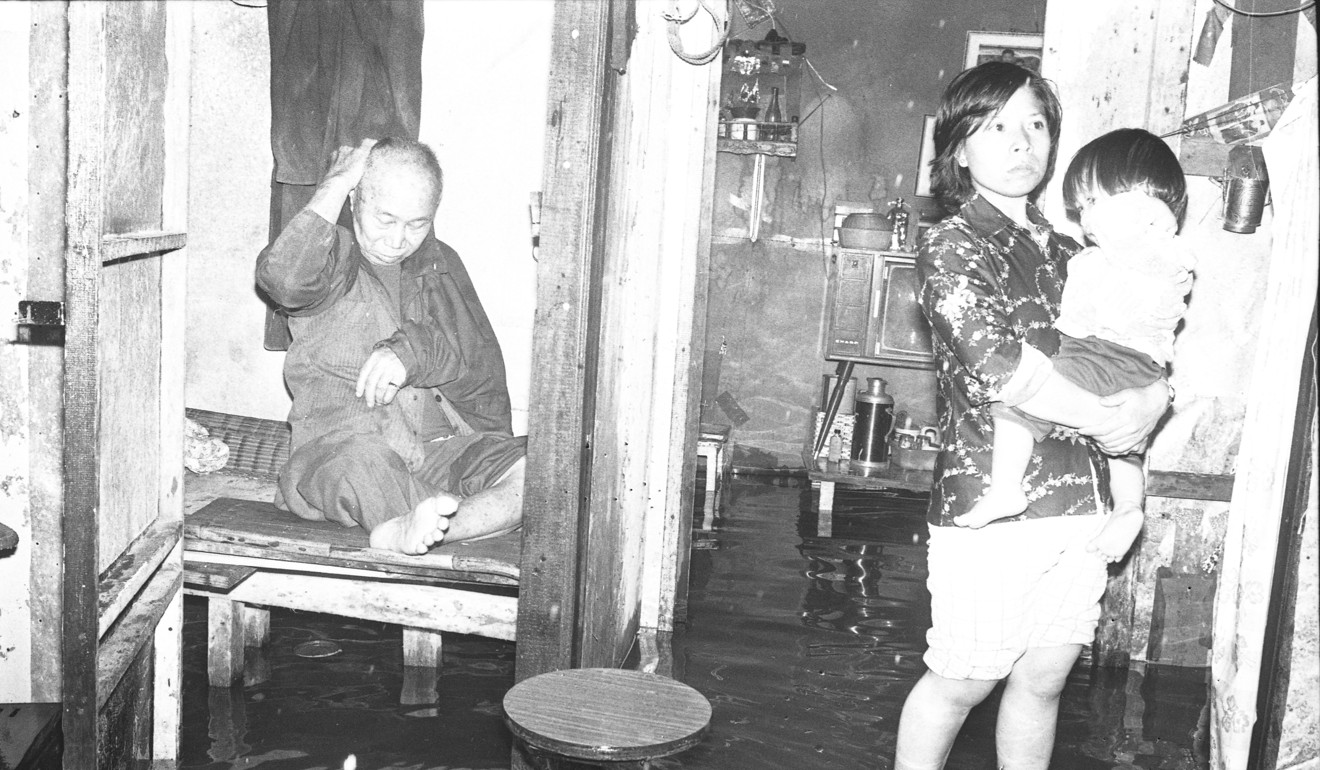
The most rainfall seen in a day was on July 19, 1926 when 534.1mm was recorded at the Hong Kong Observatory. That is more than half a metre (21 inches) in 24 hours.
In 2008, 145.5mm of rain fell in one hour, while zero monthly rainfall has been recorded in January 1914, February 1911, October 1974 and December 1909.
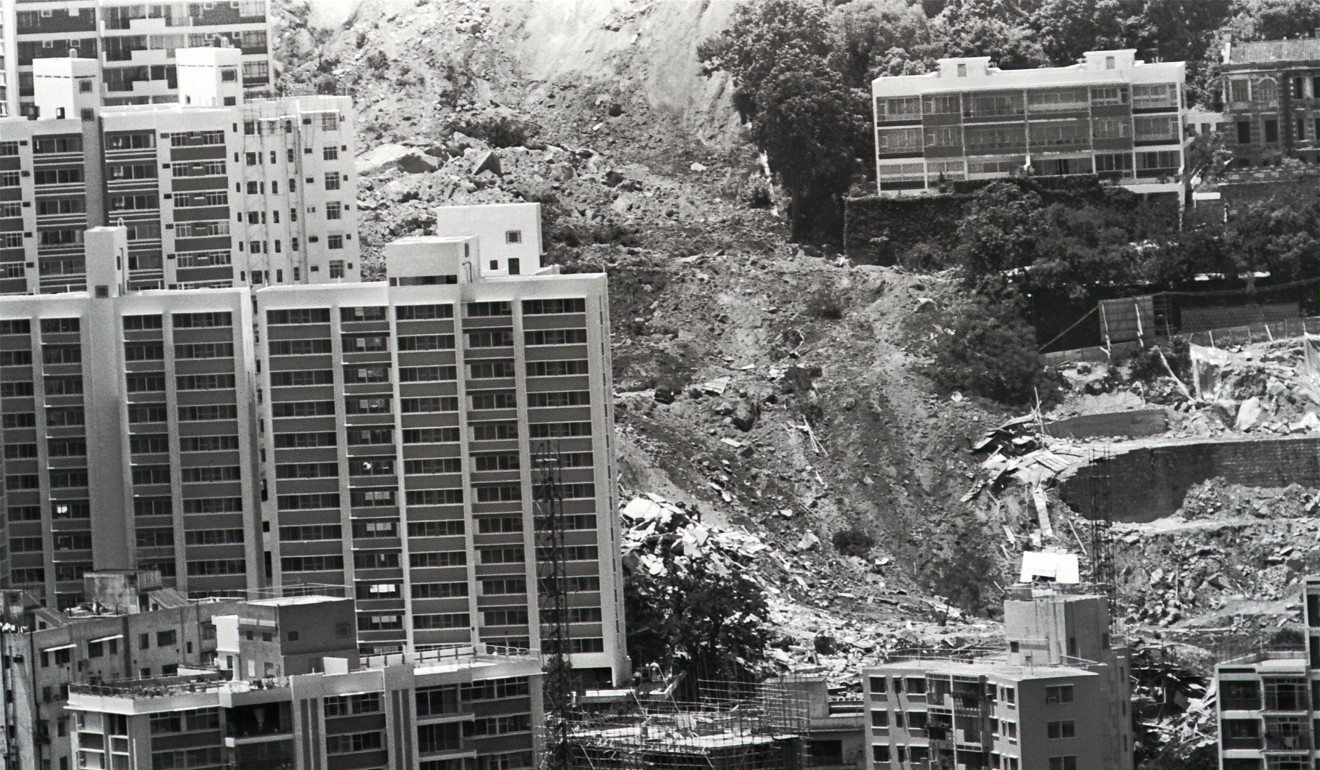
The other buried a squatter village in Sau Mau Ping, killing 71 people.
Wind
Hong Kong sees a number of typhoons every year.
Modern meteorology and satellite tracking give us ample warning of approaching storms, but there was very little prior warning before a typhoon smashed into the territory. The 1906 typhoon (see below) wasn’t spotted until it was 15 minutes from Hong Kong.
The fastest wind speed at the Hong Kong Observatory was measured in September 1962 at 259km/h.
Wind speeds over 100km/h have been recorded in every month at Waglan Island.
Speeds of more than 200km/h have been seen in July and August at both the observatory and Waglan Island.
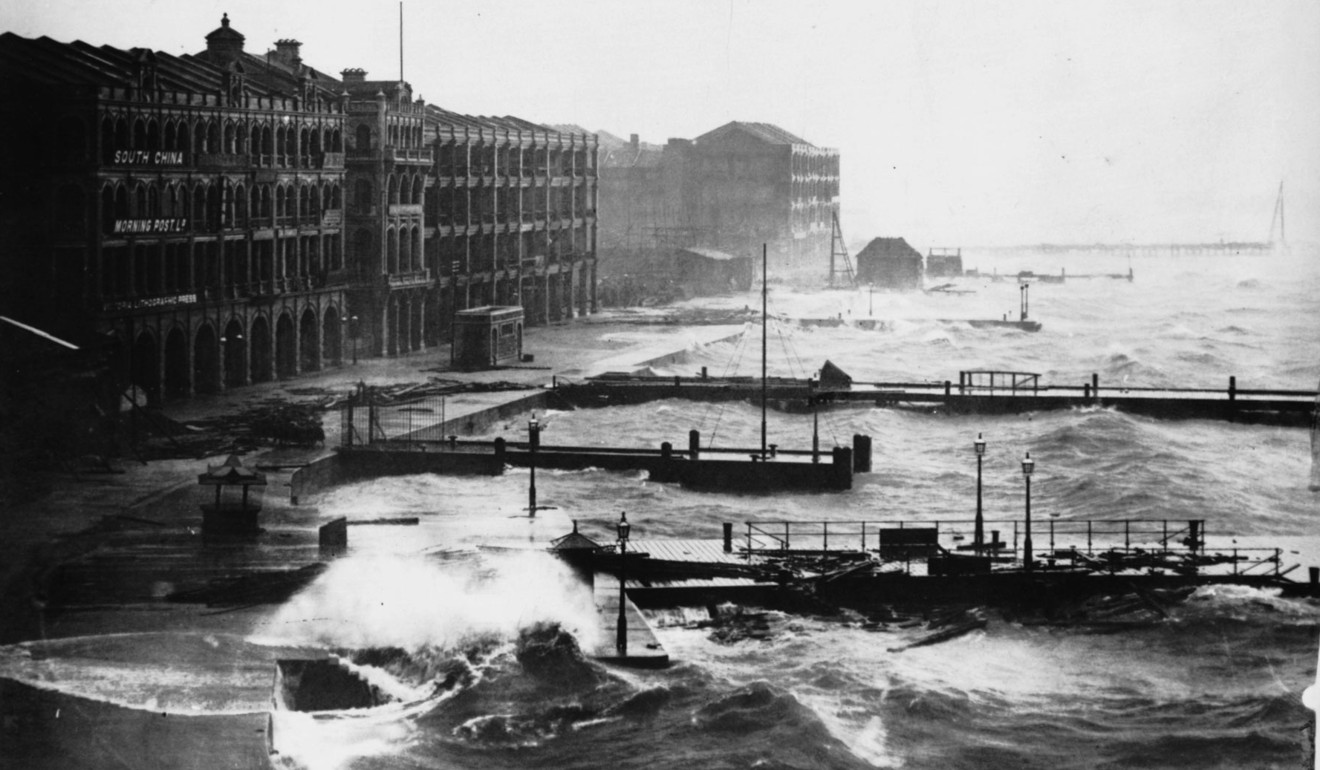
The deadliest typhoon was on September 2, 1937, when an unnamed typhoon killed 11,000 people. The wind was so strong it broke an anemometer which could record winds up to a maximum speed of 240km/h. The typhoon caused a 9.1 metre tidal surge that swamped Tai Po and Sha Tin villages causing many fatalities.
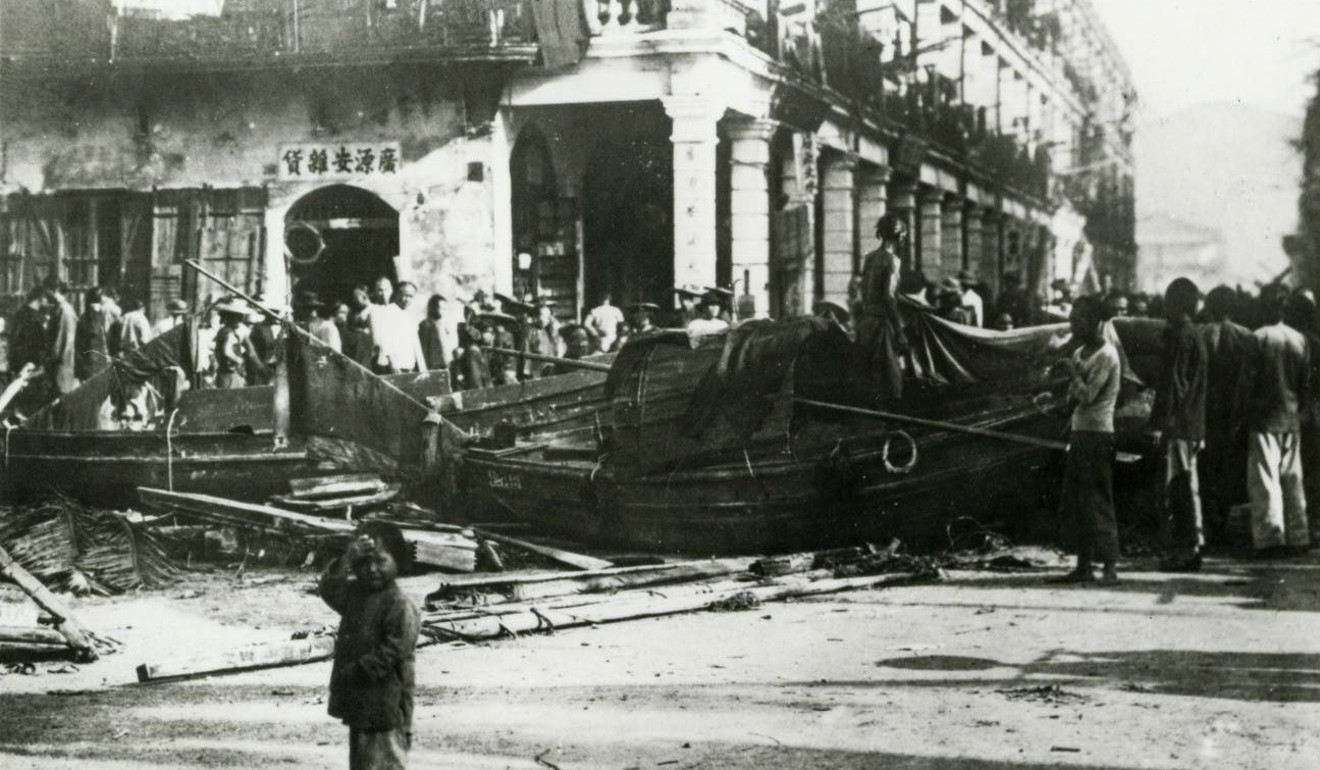
The 1906 typhoon killed about 10,000 people in two hours, which at the time was about five per cent of Hong Kong’s population.

World’s highest temperature
In 1913, Greenland Ranch in Death Valley recorded an air temperature of 56.7 degrees.
In July 1972 the ground temperature in Furnace Creek, also in Death Valley hit an astounding 93.89 degrees Celsius.
World’s lowest temperature
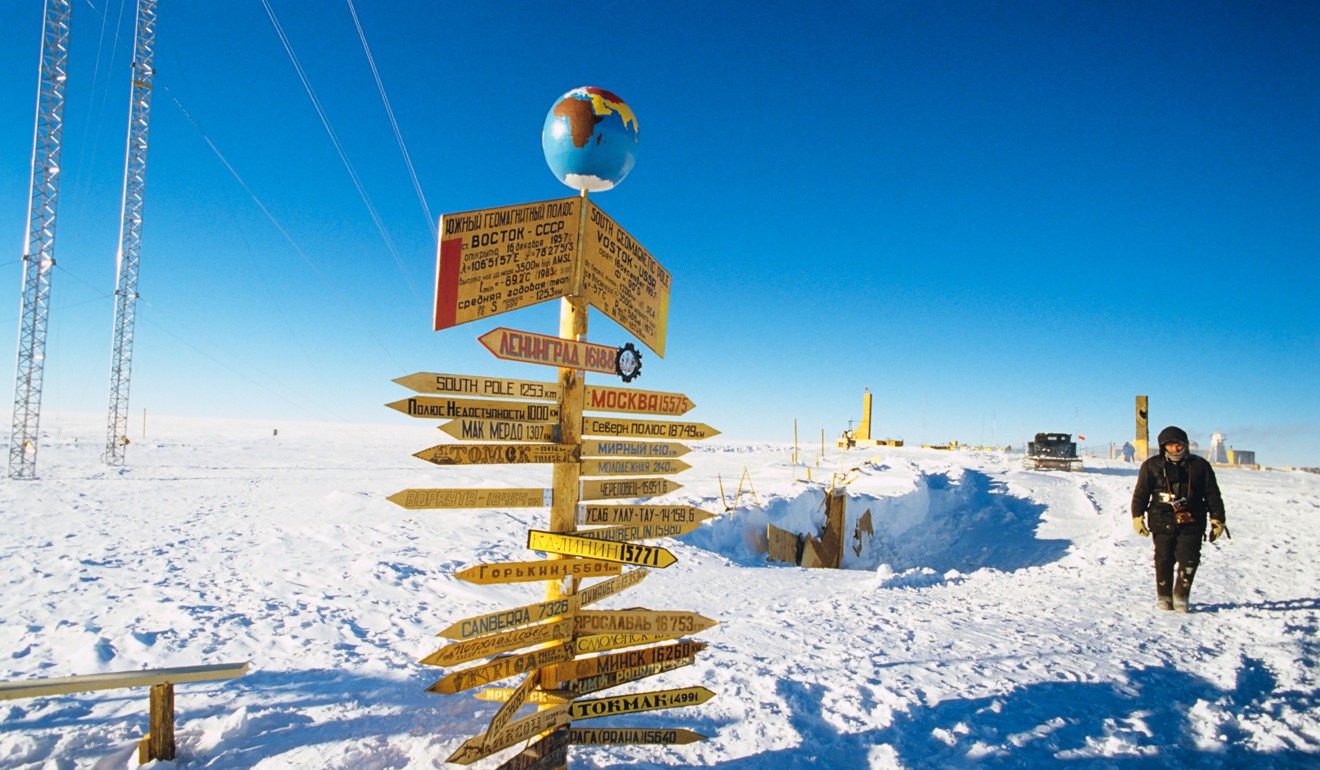
The lowest air temperature directly recorded was minus 89.2 degrees Celsius at the Soviet Vostok Station in Antarctica in 1983. The earliest recording made was on January 21, 1838, when the Russian merchant Neverov, in Yakutsk, was able to verify a temperature of minus 60 Celsius.
Rainfall (world’s highest)
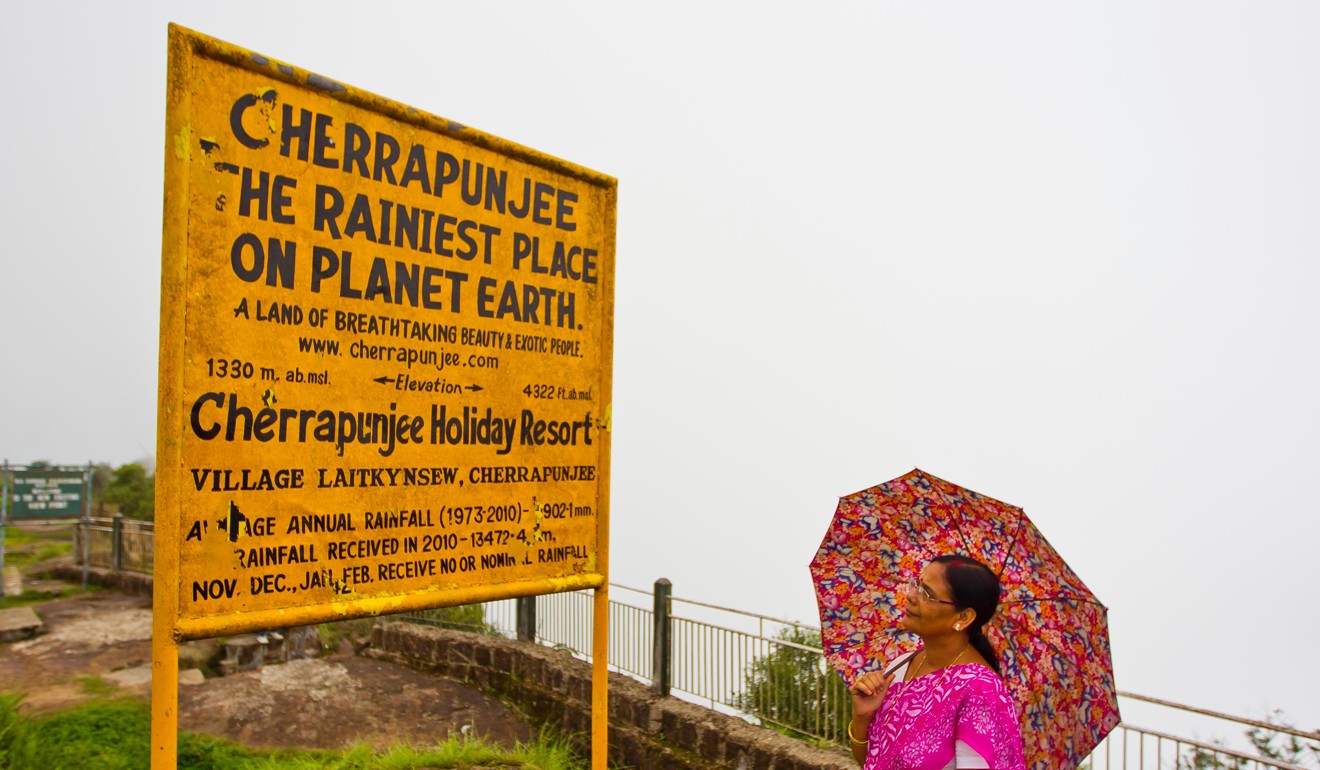
Unionville in Maryland, US received 31.2mm of rain in one minute in July 1956. In 24 hours in January 1966, 1.82 metres of rain fell on La Reunion Island. In 48 hours in June 1995, 2.49 metres of rain fell on Cherrapunji in India.
Cherrapunji also holds the annual precipitation record, a staggering 26.47 metres of rain from August 1860 to July 1861.

Rainfall (world’s lowest)
The Atacama Desert in South America is the world’s driest non-polar location, sitting at a high altitude and sandwiched by two rain shadows. The driest parts of the desert average 1mm to 3mm of rain every year. Some weather stations in the desert have never recorded rain. Evidence suggests that there was no significant rainfall in the 400 years between 1570 and 1970.
World’s windiest
The highest non-tornado wind speed was recorded at an automatic weather station in Barrow Island off Western Australia in April 1996. The anemometer recorded a gust of 408km/h.
Typhoon warning apology as storm tracks towards Hainan Island
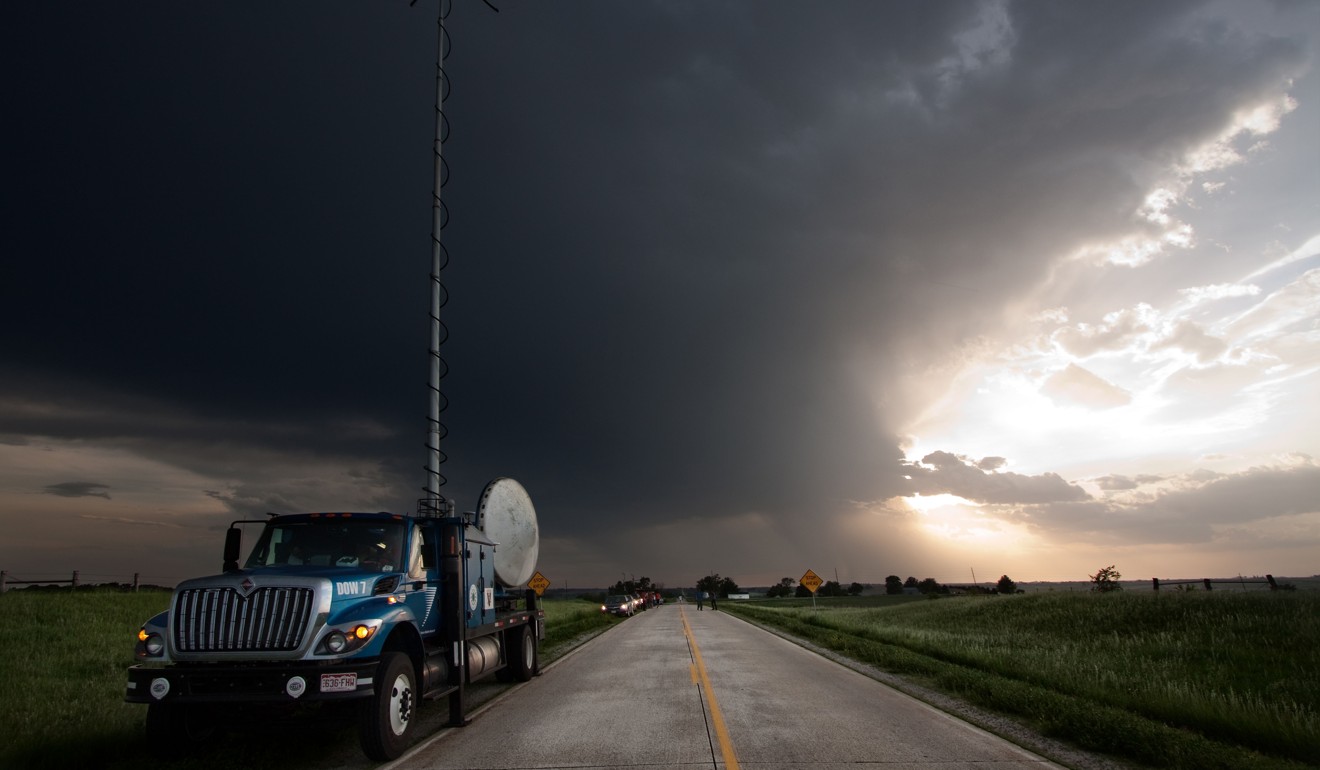
Tornado wind speeds are very difficult to measure as the violent winds destroy the equipment.
Armoured vehicles known as Doppler on Wheels (think storm chasers’ vehicles) have measured speeds of 486km/h and claimed 512km/h in tornadoes.

